doi: 10.56294/hl202328
ORIGINAL
Analyzing the Trends and Impact of Health Policy Research: A Bibliometric Study
Análisis de las tendencias y el impacto de la investigación sobre política sanitaria: Un estudio bibliométrico
Javier Gonzalez-Argote1,2 ![]() *
*
1Instituto Superior en Ciencias de la Salud Juan Pablo II. Paraguay.
2Fundación Salud, Ciencia y Tecnología. Ciudad Autónoma de Buenos Aires, Argentina.
Cite as: Gonzalez-Argote J. Analyzing the Trends and Impact of Health Policy Research: A Bibliometric Study. Health Leadership and Quality of Life. 2023;2:28. https://doi.org/10.56294/hl202328
Submitted: 05-01-2023 Revised: 01-03-2023 Accepted: 31-05-2023 Published: 01-06-2023
Editor: Dra.
Mileydis Cruz Quevedo ![]()
ABSTRACT
Introduction: bibliometric studies allow us to assess the current state of research, the contributions of authors and countries in the fields of knowledge. An investigation was carried out with the objective of describing the visibility and impact of scientific production on health policies published in Scopus.
Method: a bibliometric study of the subject was carried out in Scopus, from 2018 to 2022, variables such as total documents, number of citations, authors, most productive journals and countries, Field-Weighted Citation Impact, Quartile of journals, were analyzed. Source Normalized Impact per Paper, CiteScore, SCImago Journal Rank.
Results: the highest number of articles was found in 2022 (n=30553), the highest number of citations in 2018 (n=277749) with a weighted citation impact index per field of 1,04; 10,9 was the highest annual average number of citations per article. More than half of the articles were in journals of the first and second quartile. Among the main keywords were COVID-19, primary care, health care, health policies, health insurance. The United States stands out as the country with the most productive institutions with 6 of the top 10, with an FWCI of 2,14, the University of Oxford stands out. The BMJ Global Health magazine had a SNIP of 2,164 and an SJR of 2,376.
Conclusions: scientific production is abundant, the analysis of bibliometric indicators shows that a large part of the research is found in high-impact journals; with high levels of productivity and quality of your documents.
Keywords: Health Policies; Health Services; Bibliometric Analysis; Bibliometric Indicators.
RESUMEN
Introducción: los estudios bibliométricos permiten valorar el estado actual de las investigaciones, las contribuciones de los autores y países en los campos del conocimiento. Se realizó una investigación con el objetivo de describir la visibilidad e impacto de la producción científica sobre políticas de salud publicada en Scopus.
Método: se realizó un estudio bibliométrico de la temática en Scopus, del 2018 al 2022, se analizaron variables como el total de documentos, número de citas, autores, revistas y países más productivos, Field-Weighted Citation Impact, Cuartil de las revistas, Source Normalized Impact per Paper, CiteScore, SCImago Journal Rank.
Resultados: la mayor cantidad de artículos se encontró en el año 2022 (n=30553), el mayor número de citas fue en 2018 (n=277749) con un índice de impacto de citas ponderadas por campo de 1,04 y 10,9 fue la mayor media de citas por artículos anual. Más de la mitad de los artículos se encontraban en revistas del primer y segundo cuartil. Entre las principales palabras claves se hallaron COVID-19, atención primaria, atención de salud, políticas de salud, seguro de salud. Estados Unidos sobresale como el país con instituciones más productivas con 6 de las 10 primeras, con un FWCI de 2,14 destaca la Universidad de Oxford. La revista BMJ Global Health tuvo un SNIP de 2,164 y un SJR de 2,376.
Conclusiones: la producción científica es abundante, el análisis de indicadores bibliométricos muestra que gran parte de las investigaciones se encuentran en revistas de alto impacto; con altos niveles de productividad y calidad de sus documentos.
Palabras claves: Políticas de Salud; Servicios de Salud; Análisis Bibliométrico; Cienciometría.
INTRODUCTION
The bibliometric approach was developed from bibliometric laws since the first decades of the 20th century, its consolidation occurs with the development of information technologies and the appearance of scientific evaluation indicators such as the impact factor, immediacy index, H-index, among others.(1) They emerge as an instrument to assess the current state of research, as well as the contributions of researchers and countries in the fields of knowledge.(2)
Many health research agencies encourage researchers not only to do "good science" but also to make the impact of their research visible in other areas.(3) In many cases, the link between science and health policy is still too tenuous, so that a relevant part of the knowledge available to improve health is not applied or takes a long time to be applied.(4)
A policy is recognized as a set of actions and decisions resulting from the interaction of different political, social and institutional actors, generally taken with a view to benefiting a popular majority.(5) Health policies, on the other hand, are the decisions, plans and actions carried out to achieve specific health objectives within a society;(3) being a determinant of access to health services.(6)
They are a broad field of research covering resources on health systems, including health care delivery and management, financial analysis, health care ethics, health policy and quality of care.(7) They can affect relative factors, both in services (availability of resources, organization of services and financing) and in the population, with programs aimed at characteristics that can be modified, health knowledge and practices, insurance coverage or information on services.(6)
According to Scimago Jornal and Country Rank,(8) The United States, from 1996 to 2022, is the country with the most articles available in the Scopus database in the health sector; for a total of 300,344 citable documents, followed by the United Kingdom, Australia, Canada and Germany. After a general search, it is possible to appreciate the large amount of information available on management in the health sector, which makes health policies emerge as a booming area of research, so the evaluation of the current state of this production is a means to identify contributions and new challenges in the field.
In view of the above, the present research was conducted with the aim of describing the visibility and impact of the scientific production on health policies published in the Scopus database from 2018 - 2022.
METHODS
A bibliometric, observational, descriptive and retrospective study was conducted, including articles published from 2018 to 2022 in the Scopus database on health policies.
The dataset was downloaded in automatically generated RIS format, which was then exported to SciVal. All articles on the subject published in journals included in Scopus were included, without discriminating by language or area of knowledge.
The main variables evaluated were the year of publication, number of documents per year, top 1 % and 10 % of documents included in the most cited percent of their area, number of citations, average number of citations per article, most productive authors, institutions and journals.
Bibliometric indicators make it possible to explore scientific production and its impact in a given thematic area.(9) For a correct stratification of the variables, the following were also analyzed:
· Field-Weighted Citation Impact: the Field-Weighted Citation Impact (FWCI) is an indicator of the average impact of citations and compares the actual number of citations received by a document with the expected number of citations for documents of the same type, year of publication and subject area. It can be interpreted by obtaining values greater than one, indicating that citations were obtained above the average in the field studied, and less than the opposite.(10)
· Quartile of journals: based on SJR and divided into four equal groups (Q1, Q2, Q3 and Q4). It is interpreted as the importance of a journal in its field.(11) For the present work, it was analyzed according to the year in which the articles were published.
· Source Normalized Impact per Paper (SNIP): based on the citations received during a year to articles, reviews and conference papers published in the previous three years, divided by the number of articles, reviews and conference papers published in those three years.(12)
· CiteScore: is calculated with the total number of citations in a given year for all papers published in the last three years, divided by the total number of papers published in the same period. Consequently, one of its most important characteristics is transparency, since it does not attempt to classify and limit by article type; and since it is based on a Scopus dataset, it is broad and free.(12)
· SCImago Journal Rank (SJR): is a measure of the scientific influence of academic journals that explains both the number of citations received by a journal and the importance or prestige of the journals from which these citations originate. The SJR is a numerical value that indicates the average number of weighted citations received during a selected year, per paper published in that journal during the previous three years. The indicated prestige rises with the value of the figure obtained.(12)
Although studies with similar characteristics to the present one were found, there is a scarcity of this type of research oriented to health policies and management, so in order to contrast the results obtained with those of other authors, we used research with similar methodological characteristics, focused on topics as close as possible to the chosen one. For this purpose, a total of 33 references were used, of which more than 50 % were published in the last 5 years.
RESULTS
The highest number of published articles was found in the year 2022 (n=30553); with a trend of progressive increase by years; the highest number of citations was received by articles published in the year 2018 (n=277749), with a field-weighted citation impact index of 1,04; followed by articles from 2020 (n=253564); 10,9 was the highest number of citations per articles per year reached, corresponding to the year 2019. The years 2020, 2021 and 2022 correspond with the highest percentage of published articles that are in the top1 % most cited in their field (n=1,1 %); also highlighting publications from 2018 where 10,9 % were positioned among the top10 %. (table 1).
|
Table 1. Distribution of articles and citations by year |
||||||
|
Year |
Ndoc |
Top1 %* |
Top10 %* |
Quotations |
Citations per article |
Field-Weighted Citation Impact |
|
2018 |
19834 |
1,0 % |
10,9 % |
277749 |
14 |
1,04 |
|
2019 |
21053 |
0,9 % |
9,8 % |
229404 |
10,9 |
1 |
|
2020 |
24794 |
1,1 % |
9,3 % |
253564 |
10,2 |
0,99 |
|
2021 |
29778 |
1,1 % |
9,5 % |
199094 |
6,7 |
0,99 |
|
2022 |
30553 |
1,1 % |
9,6 % |
107421 |
3,5 |
1,01 |
|
*Top 1 %: percentage of articles in the top 1 % most cited in the area. *Top 10 %: percentage of articles in the 10 % most cited in the area. |
||||||
Table 2 shows how the largest number of articles were published in journals belonging to the first and second quartile, where the year 2021 stands out with 10040 documents, being this year also the one with the largest number of articles found in journals of the fourth quartile (n=4001).
|
Table 2. Distribution of articles according to quartile of the journals. |
||||
|
Year |
Q1 |
Q2 |
Q3 |
Q4 |
|
2018 |
7343 |
5309 |
3167 |
2840 |
|
2019 |
7819 |
5220 |
3392 |
2790 |
|
2020 |
8325 |
5402 |
4353 |
3190 |
|
2021 |
10040 |
7590 |
6248 |
4001 |
|
2022 |
9964 |
8502 |
7041 |
3984 |
Figure 1 shows that the main keywords found are: COVID-19, primary care, health care, pandemic, systematic review; in the background are also terms such as: health policies, health insurance, quality of health care.
Table 3 shows that the author with the greatest number of documents was Traynor Kate with a total of 224, receiving 88 citations and an average number of citations per article of 0,4. On the other hand, McKee Martin J. followed by Savulescu Julian, received the highest number of citations with 2055 and 1698 respectively; McKee coinciding with the highest number of citations per article with 22,8.
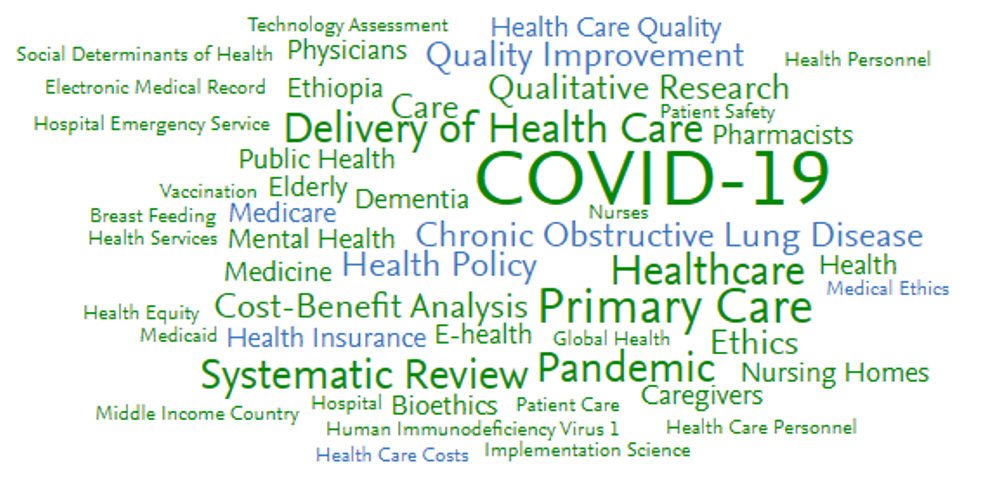
Figure 1. Keyword map
|
Table 3. Most productive authors |
|||
|
Name |
Ndoc |
Quotations |
Citations per article |
|
Traynor, Kate |
224 |
88 |
0,4 |
|
Drapkina, O. M. |
174 |
534 |
3,1 |
|
Stephenson, Joan |
137 |
298 |
2,2 |
|
Savulescu, Julian |
108 |
1698 |
15,7 |
|
McKee, Martin J. |
90 |
2055 |
22,8 |
|
Braithwaite, Jeffrey |
81 |
1307 |
16,1 |
|
Bhatnagar, Sushma |
79 |
315 |
4 |
|
Zimmerman, Sheryl Itkin |
77 |
667 |
8,7 |
|
Sloane, Philip D. |
69 |
585 |
8,5 |
|
Postma, Maarten Jacobus |
69 |
760 |
11 |
The United States stands out as the country with the most productive institutions with 6 of the top 10. Harvard University stands out in first place with a total of 3310 documents, 50782 citations and 15,3 citations per article. The University of California, San Francisco, received the highest number of citations per article (n=18,8); while Oxford University stands out with a FWCI of 2,14. (table 4)
|
Table 4. Most productive institutions |
||||||
|
Institution |
Sector |
Country |
Ndoc |
Quotations |
Citations per article |
FWCI |
|
Harvard University |
Academic |
United States |
3310 |
50782 |
15,3 |
1,82 |
|
Johns Hopkins University |
Academic |
United States |
2346 |
31327 |
13,4 |
1,53 |
|
University of Toronto |
Academic |
Canada |
2212 |
29250 |
13,2 |
1,52 |
|
London School of Hygiene and Tropical Medicine |
Academic |
United Kingdom |
1774 |
30417 |
17,1 |
1,95 |
|
University of Oxford |
Academic |
United Kingdom |
1684 |
29631 |
17,6 |
2,14 |
|
Department of Veterans Affairs |
Governmental |
United States |
1575 |
20856 |
13,2 |
1,52 |
|
University of Washington |
Academic |
United States |
1566 |
21051 |
13,4 |
1,66 |
|
University College London |
Academic |
United Kingdom |
1493 |
26224 |
17,6 |
1,91 |
|
University of Pennsylvania |
Academic |
United States |
1476 |
22770 |
15,4 |
1,49 |
|
University of California at San Francisco |
Academic |
United States |
1371 |
25777 |
18,8 |
1,92 |
The most productive journal was BMC Helth Services Resarch, with 6152 documents, 63385 citations and 10,3 citations per article. With a SNIP index of 2,164, the journal BMJ Global Health stands out, followed by the American Journal of Boethics (n=1,962), which also has a CiteScore of 11. With greater scientific influence, measured by an SJR indicator of 2,376, the journal BMJ Global Health also stands out. (table 5).
|
Table 5. Most productive journals |
||||||
|
Scopus Source |
Ndoc |
Quotations |
Citations per article |
SNIP |
CiteScore 2022 |
SJR |
|
BMC Health Services Research |
6152 |
63385 |
10,3 |
1,347 |
4 |
0,964 |
|
Healthcare (Switzerland) |
5215 |
34904 |
6,7 |
0,873 |
2,7 |
0,55 |
|
Science and Collective Health |
2352 |
13603 |
5,8 |
0,971 |
2,8 |
0,564 |
|
BMJ Global Health |
2159 |
40178 |
18,6 |
2,164 |
9,1 |
2,376 |
|
Journal of the American Medical Directors Association |
1927 |
29837 |
15,5 |
1,97 |
9,6 |
1,794 |
|
American Journal of Health-System Pharmacy |
1921 |
9265 |
4,8 |
1,133 |
2,6 |
0,464 |
|
American Journal of Bioethics |
1674 |
8053 |
4,8 |
1,962 |
11 |
1,219 |
|
Health and Social Care in the Community |
1626 |
13326 |
8,2 |
1,413 |
3,3 |
0,923 |
|
American Journal of Infection Control |
1615 |
19359 |
12 |
1,313 |
7,4 |
1,118 |
|
International Journal of COPD |
1601 |
17656 |
11 |
1,02 |
4,8 |
0,924 |
DISCUSSION
A bibliometric analysis of the topic allows a visualization of its current state, as a thematic line it has both strengths and weaknesses, however, the true impact of the available bibliography on this topic is not known with certainty.
The tendency to increase the number of publications by year is not a new finding; many other authors report this, including Fusco(13) and Bran Piedrahita.(14) However, there may be differences in terms of the most productive year as reported by Zhao,(7) in his mapping of research in health services and policies; who found the highest production 2015 to 2018.
Kofi Nti,(15) performs a bibliometric analysis on sustainable health care technology, where the predominance and increase of publications begins in 2018 and tends to a stable increase. Regarding the number of citations, Deng & Romainoor(16) found a predominance in 2009, it is valid to clarify that the period of time in which their study is developed is longer than the present one.
The differences found in these variables could be due to many causes; in the case of the present study, the increase in recent years could be justified by the impact of the COVID-19 pandemic, which forced international health systems to adopt new measures and restructure their policies in response to special situations, which may have favored publication in this area.
Franco Romaní,(17) in his analysis of the original scientific publications of the National Institute of Health of Peru, reports an increase in the number of citations per year, with its maximum value in 2018, which corresponds to the deadline included in this study. In contrast, the present article reports a proportional increase with respect to age; this data can be predictable if it is considered that the probability of citations could increase as time goes by, precisely this factor is the one that evokes the emergence of the citation index corrected by years. In this regard, it is worth clarifying that only 5 years were studied in order to prevent biases of this type.
Regarding the FWCI index; Muñoz-Estrada,(9) reports 5,71 as the highest value when distributed by institutions and 1,99 by journals, Mila Cascajares,(18) found an index of 3,95 per journal; the values vary in the bibliography according to the subject matter and form of analysis. When analyzing the given concept of this indicator, the values found by authorship indicate that most of the articles published on the subject received more citations than expected for publications with similar characteristics, although this not only speaks of the quality of the article but also of the journal in which it is published, as well as of its editorial management.
Considering the amount of research reported as included in the top 1 % and 10 % of its topic, it is interpreted as a positive indicator of the characteristics of the documents published on health policies in the period of time considered. Being considered as influential and popular articles in the scientific community, they add value and increase the research potential in this subject.
Leyton Pavez,(19) in their bibliometric analysis of the scientific literature on health network management control, only two of the journals where they found articles were in Q2, the rest belonged to Q1. These figures acquire greater value when clarifying that the search period was 51 years. Ruíz Orjuela,(20) in his research on hospital supply chain metrics, reports that all the journals belonged to Q1 and Q2. Other authors such as Zhao,(7) found more heterogeneous values such as seven journals in Q1, seven in Q2, five in Q3 and one in Q4. Grasso(21) and Muñoz Estrada(9) reported a predominance of journals in quartile 1 and 2 in their studies.
The value of the quartile as a bibliometric indicator would be on the importance, and therefore, the impact of a journal in its environment, so that the results reported by the authorship denote that most of the research was found in prestigious scientific dissemination bodies, although about half of the total belonged to Q3 and Q4.
If we analyze the keywords, Sarmiento Ramírez,(22) in his bibliometrics on public policy in the pandemic, found three fundamental nodes around the words COVID-19, public policy and coronavirus. Bran Piedrahita et al.(14) in their analysis of research trends in health economics, had as main keywords: health care cost, health care policy, health care system, cost benefit analyst, health services, methodology, health care planning, public health service.
Machine Learning, Health Informatics, Medical Informatics, Healthcare were frequent key words in Kofi Nti's study;(15) while Zhao,(7) reports HIV infections, primary health care, delivery of health care, and health services accessibility. On this variable, it is worth noting that the concurrence of keywords can move indistinctly within the health policy themes, being particularly evident the presence of terms related to the pandemic for the selected period of time.
Grasso,(21) found that the author with the most citations received a total of 296, something similar happened with Xiaomei Luo,(23) with 261, while Altaf Virani's figures are reduced to 116.(24) These values below those reported in this study are justified by the differences between the topics; however, less close but methodologically related research reports figures such as those of Wanden-Berghe,(25) with 4730 citations.
Figures reported include: 11,4 citations per article for the most productive institutions according to Muñoz Estrada,(9) 31,88 as the maximum value for the most productive authors according to Deng & Romainoor,(16) Grasso(21) Grasso reports 40,25 as the maximum number of citations per year when stratifying the documents by journals.
In the opinion of the authors, the average number of citations per article is a variable that varies according to various factors, so that its value should not be interpreted as a primary determinant of the impact of a journal or subject, but rather as a supplement or approximation of its true value.
According to the most productive country, the United States coincides in almost all similar bibliography as the main country,(7,15,19,20) some differ, such as Bran Piedrahita,(14) with the United Kingdom in first place and Santosh Nayak,(26) with India. However, it is worth mentioning that other countries frequently found in the first positions are China, Canada and Australia.(15,20) The above data could be justified when considering the scientific-research power that is the United States, where scientific training is promoted from student life, which also has influential international databases such as Pubmed.
When reviewing the most productive institutions we see heterogeneous results within the similar bibliography, such as Harvard University with 1,99 FWCI as expressed by Muñoz Estrada,(9) Zhao,(7) found Harvard University, University of California and London University topping the productivity list, with 2632, 2895 and 2176 articles, respectively.
Harvard School of Medicine followed by the University of Washington ranked first in Kofi Nti's results.(15) Bran Piedrahita,(14) found the University of York followed by King's College London and other dissimilar reports. The common factor in the variety of institutions is their geographical location, since they are mainly from the United States and the United Kingdom, and the lack of coincidence is due to the lack of studies on this specific subject.
Zhao,(7) indicates that Health Affairs (63,667 citations), AIDS Care-psychological and Socio-medical Aspects of AIDS/HIV (23,116 citations), Quality of Life Research (30,509), Psychiatric Services, Health and Quality of Life Outcomes were the 5 most productive journals. For Leyton Pavez,(19) the journal Nature predominated in the list according to the number of citations.
Sarmiento Ramírez,(22) found Science of the Total Environment as the journal with the highest impact index; Santosh Nayak,(26) Plos One with 5,3. Urgiles Rojas,(27) in his bibliometric analysis of problem-based learning in the health sciences, reports a maximum SJR of 0,99. Muñoz-Estrada,(9) notes that Academic Medicine with 1,66 was the highest SJR, with a CiteScore of 6,8 and a SNIP of 2,59.
Attempting to contrast these results with those of the present study would not be an accurate comparison because the characteristics and thematic areas of the research are not ideal in terms of similarity. However, it is valid to emphasize that a SNIP above one in eight of the 10 most productive institutions and journals indicates an impact above what is expected in that area. Other reported indicators such as CiteScore, SJR and FWCI are in a similar situation.
The author wishes to clarify, in general terms, that many studies report on the quality of health services.(28,.29,30) This has become a fundamental aspect in today's medicine, due to the complexity of these services, which require that an adequate functioning be guaranteed in order to contribute to the health status of the communities.(31)
There are tendencies in the sector to waste healthcare, unjustified variation in clinical practice, administrative burden, fraud and abuse. This means that health policy makers have to deal with different situations in order to contain health disasters.(32) The sustainability of a system depends not only on the availability of resources, but also on how they are used, where and for what purpose. Policies must contemplate appropriate actions in the face of certain factors that can affect the population, so that healthcare systems can provide a healthcare response in accordance with predictive knowledge, a preventive attitude, periodicity of diagnosis and maximum efficiency of resolution.(33)
The main limitations of the study include the lack of available literature in the chosen subject area, the fact that only articles from the Scopus database were analyzed, the language, although articles in English were also included, and the nature of the study, so that no literature review was carried out.
CONCLUSIONS
The scientific production on health policy in Scopus from 2018 to 2022 is abundant, with a tendency to grow in recent years, mainly focused on countries such as the United States and the United Kingdom, the analysis of bibliometric indicators shows that much of the research is in high impact journals; with high levels of productivity and quality of their documents.
BIBLIOGRAPHIC REFERENCES
1. Vaidyanathan N, Henningsson S. Designing augmented reality services for enhanced customer experiences in retail. Journal of Service Management 2022;34. https://doi.org/10.1108/JOSM-01-2022-0004.
2. Liu R, Balakrishnan B, Saari EM. How AR Technology is Changing Consumer Shopping Habits: from Traditional Retail to Virtual Fitting. Academic Journal of Science and Technology 2024.
3. Saikia K, Nayak B, Kr M, Muchahari, Kumar P, Muchahari M. Augmented Reality Based Online Application For E-Shopping. INTERNATIONAL JOURNAL OF ADVANCED RESEARCH IN ENGINEERING & TECHNOLOGY 2021;12:212–32. https://doi.org/10.34218/IJARET.12.3.2021.022.
4. Trinidad JIM. Consumers? online shopping experience with augmented reality : a way to influence consumers? knowledge and behavior 2020.
5. Tan Y-C, Chandukala SR, Reddy SK. Augmented Reality in Retail and Its Impact on Sales. Journal of Marketing 2022;86:48–66. https://doi.org/10.1177/0022242921995449.
6. Yoo J. The effects of augmented reality on consumer responses in mobile shopping: The moderating role of task complexity. Heliyon 2023;9. https://doi.org/10.1016/j.heliyon.2023.e13775.
7. Schultz CD, Kumar H. ARvolution: Decoding consumer motivation and value dimensions in augmented reality. Journal of Retailing and Consumer Services 2024;78:103701. https://doi.org/10.1016/j.jretconser.2023.103701.
8. Romano B, Sands S, Pallant J. Augmented Reality and the Customer Journey: An Exploratory Study. Australasian Marketing Journal (AMJ) 2020;29. https://doi.org/10.1016/j.ausmj.2020.06.010.
9. Voicu M-C, Sîrghi N, Toth DM-M. Consumers’ Experience and Satisfaction Using Augmented Reality Apps in E-Shopping: New Empirical Evidence. Applied Sciences 2023;13. https://doi.org/10.3390/app13179596.
10. Tjhin VU, Putri A. Analysis of factors affecting the intention to use augmented reality technology in Indonesia’s online retail customer. Journal of Theoretical and Applied Information Technology 2021;99:4376–88.
11. Lu Y, Smith S. Augmented Reality E-Commerce Assistant System: Trying While Shopping. Interacción, 2007.
12. Jiang Y, Wang X, Yuen KF. Augmented reality shopping application usage: The influence of attitude, value, and characteristics of innovation. Journal of Retailing and Consumer Services 2021;63:102720. https://doi.org/10.1016/j.jretconser.2021.102720.
13. Smink AR, Frowijn S, van Reijmersdal EA, van Noort G, Neijens PC. Try online before you buy: How does shopping with augmented reality affect brand responses and personal data disclosure. Electronic Commerce Research and Applications 2019;35:100854. https://doi.org/10.1016/j.elerap.2019.100854.
14. Jusoh W, Mohd Ishar NI, Fikry A. UNDERSTANDING ONLINE SHOPPING EXPERIENCE WITH AUGMENTED REALITY (AR) MOBILE APPS: A GROUNDED THEORY APPROACH. Jurnal Evolusi 2023;4:1–21.
15. Qadri S, Mir M, Khan Mu. Exploring the Impact of Augmented Reality on Customer Experiences and Attitudes: A Comparative Analysis with Websites. International Journal of Management Research and Emerging Sciences 2023;13. https://doi.org/10.56536/ijmres.v13i2.421.
16. Kumar H, Rauschnabel PA, Agarwal MN, Singh RK, Srivastava R. Towards a theoretical framework for augmented reality marketing: A means-end chain perspective on retailing. Information & Management 2024;61:103910. https://doi.org/10.1016/j.im.2023.103910.
17. Ozturkcan S. Service innovation: Using augmented reality in the IKEA Place app. Journal of Information Technology Teaching Cases 2021;11:8–13. https://doi.org/10.1177/2043886920947110.
18. Vaghela P. AUGMENTED REALITY AND CONSUMER BEHAVIOUR: QUALITATIVE ANALYSIS OF EMPIRICAL RESEARCH IN ONLINE SHOPPING CONTEXT 2023;XXIV:116–24.
19. Chylinski M, Heller J, Hilken T, Keeling DI, Mahr D, de Ruyter K. Augmented Reality Marketing: A Technology-Enabled Approach to Situated Customer Experience. Australasian Marketing Journal 2020;28:374–84. https://doi.org/10.1016/j.ausmj.2020.04.004.
20. Baytar F, Chung T-L, Shin E. Evaluating garments in augmented reality when shopping online. Journal of Fashion Marketing and Management: An International Journal 2020;ahead-of-print. https://doi.org/10.1108/JFMM-05-2018-0077.
21. Lavoye V, Tarkiainen A, Sipilä J, Mero J. More than skin-deep: The influence of presence dimensions on purchase intentions in augmented reality shopping. Journal of Business Research 2023;169:114247. https://doi.org/10.1016/j.jbusres.2023.114247.
22. P A kumar., R Murugavel. Prospects of Augmented Reality in Physical Stores’s using Shopping Assistance App. Procedia Computer Science 2020;172:406–11. https://doi.org/10.1016/j.procs.2020.05.074.
23. Pfeifer P, Hilken T, Heller J, Alimamy S, Di Palma R. More than meets the eye: In-store retail experiences with augmented reality smart glasses. Computers in Human Behavior 2023;146:107816. https://doi.org/10.1016/j.chb.2023.107816.
24. Cruz E, Orts-Escolano S, Gomez-Donoso F, Rizo C, Rangel JC, Mora H, et al. An augmented reality application for improving shopping experience in large retail stores. Virtual Reality 2019;23:281–91. https://doi.org/10.1007/s10055-018-0338-3.
25. Wang C-H, Chiang Y-C, Wang M-J. Evaluation of an Augmented Reality Embedded On-line Shopping System. Procedia Manufacturing 2015;3:5624–30. https://doi.org/10.1016/j.promfg.2015.07.766.
26. Hoffmann S, Joerß T, Mai R, Akbar P. Augmented reality-delivered product information at the point of sale: when information controllability backfires. Journal of the Academy of Marketing Science 2022;50:743–76. https://doi.org/10.1007/s11747-022-00855-w.
27. Wang Y, Jiang Y, Liu R, Miao M. A configurational analysis of the causes of the discontinuance behavior of augmented reality (AR) apps in e-commerce. Electronic Commerce Research and Applications 2024;63:101355. https://doi.org/10.1016/j.elerap.2023.101355.
FINANCING
The authors did not receive funding for the development of this research.
CONFLICT OF INTEREST
The authors declare that there is no conflict of interest.
AUTHORSHIP CONTRIBUTION
Conceptualization: Javier Gonzalez-Argote.
Research: Javier Gonzalez-Argote.
Methodology: Javier Gonzalez-Argote.
Editor - original draft: Javier Gonzalez-Argote.
Writing - proofreading and editing: Javier Gonzalez-Argote.